#ICCM, trended last week on twitter!The International Conference of Crisis Mappers, 2013 took place in Nairobi over a span of five days. “Technology and Innovation for crisis mapping, in and outside Africa” was the theme. It was a rich convention of industry practitioners in the crisis mapping space.
I could write a ‘book’ I think,though for purposes of enjoying my reminisce, I will stick to what I like talking about, DATA, MAPS & TECH TOOLS! Data means different things to different people- a panelist in the “What’s so Big about Big Data?” session opined.
Data discussions
Big data
For the ICCM context, data may zero down to the kind that allows for coordination during a crisis, early warning preparations and post crisis management.According to ICCM discussions,data from social media has already gone along way in shaping how humanitarian activations are carried out. The Hurricane Haiyan crisis got several humanitarians working to provide relief to affected people, for example DHN and MicroMappers. One way of looking at it is appreciating how diverse one’s intentions might be when they post a tweet. So it turns out that even though it’s all technology aiding this kind of communication, one cannot under-estimate the power of integrating human psychology in synthesizing all this information and designing algorithms that incorporate the very subtle bits of what might not be expressed in a tweet. Hermant Purohit a Phd candidate with Knoesis team delved deeper into this when he gave an Ignite Talk.
Some of the challenges highlighted in synthesizing social media data came up as :
- authenticity/ validity: where do we draw the line?
- temporal relevance: a tweet that’s as late as 1 day may not be relevant.
- scaling machine learning tools that synthesize the data is not easy: the data is not static because humans generate new data quickly.

Aditya Vashistha of IVR Junction, Presents on “Generating, Analyzing &
Using Information from Hard-to-Access Areas”
So you might want to take all the flurry on social media with a pinch of salt or better still make supported assumptions for the machine learning algorithms that would allow for graceful use of social media information, in crisis management, for that matter.
This big data talk tickled my mind…I ended up thinking that the millions of volunteers making maps to ease coordination for devastation caused by hurricane Yolanda were actually doing a big data gig: 2million plus digital hands editing many tiles of satellite imagery plus other crowd sourced geospatial information to make life better for the Philippine people!
Open data commons– another dimension of data.
The School of Data and UNOCHA had a self organised session on how crisis mappers can leverage open data to quicken humanitarian response, the discussion delved into data issues like curation, informatics/open data working groups for crisis mappers, cleaning and quality, granularization of big datasets for easier use by smaller groups of people and the big time need of training and mentoring in a space where data needs seem to change by the hour. OKFN’s Ruffus Polock shares his thoughts in an article titled Forget big data, small data is the real revolution.
Then we veered off a little, discussing, “How much of personal information should be out there for the world to see?” in the open data context. This turned out to be an uncomfortable topic so we quickly got back to discussing what role open data plays in crisis management and how the open data commons tool can be harnessed to make this possible. More of what came out of this discussion here .
Teaching and learning
Data Track
The tech and training session run for a day and had four tracks, Mobile/Security, Maps, Data & Knowledge. These sessions were meant to allow people learn and teach in small groups. School of Data run the Data & Knowledge session. As a volunteer mentor at School of Data, I was invited to give an Introductory training to Geocoding and Mapping using Google fusion tables. I thought it very basic in the beginning but it turned out helpful for the folk who attended the Data and Knowledge session, with data cleaning(Michael Bauer from OKFN), spreadsheet basics(Steve Kemei, Development Initiatives) and basic dataviz(Agnes Rube, Internews) mini sessions to go with it. Google fusion tables is an experimental version, this means it could change anytime. Try out open source options like cartodb, QGIS and more services for your geocoding and mapping needs.

Photo Credit: iHub
Maps
What is a crisis mappers convention without a party? I mean a mapping one. Heather Leson and Severin Menard of the Humanitarian OpenStreetMap Team put together a map-up where once again I joined as a co-trainer on mapping an area that needs urgent humanitarian and volunteer contribution, the Philippines. If you can contribute your OSM mapping skills, please do. Heather gives a detailed account of the map-up here.
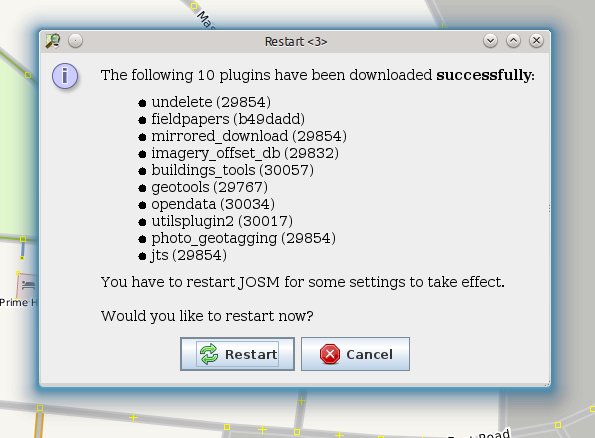
One last thing about using the HOT tasking manager, JOSM’s performance can improve, considerably if you install the list of plugins captured in the screen dump below. This works for tasking manager jobs- Thanks to HOT’s Severin Menard for this priceless tip!
Finally but not least, I gave a talk on How the team at Fruits of Thought is “Building a robust mapping community in Uganda” and making it even easier by developing very simple mapping tools to complement the community effort.
We’d appreciate feedback on these tools so that we can improve them, use them to map and let us know how it all goes.
